This 2nd lecture we browsed the rest of the SVM slides, and at least for my part I was not able to get much out of it because the slides were inconsistent or lacking definition of symbols used in the formulas. So, in order to make any sense out of SVM, I visited the Machine Learning course at Coursera I already signed up for earlier this year. The videos should be available on YouTube as well.
My main steps now are:
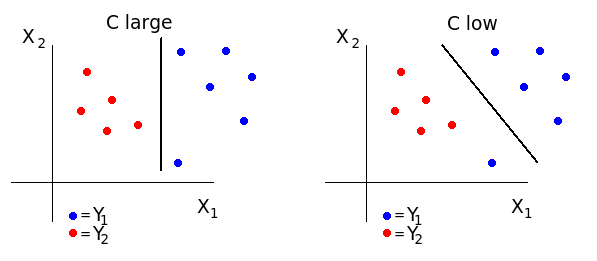
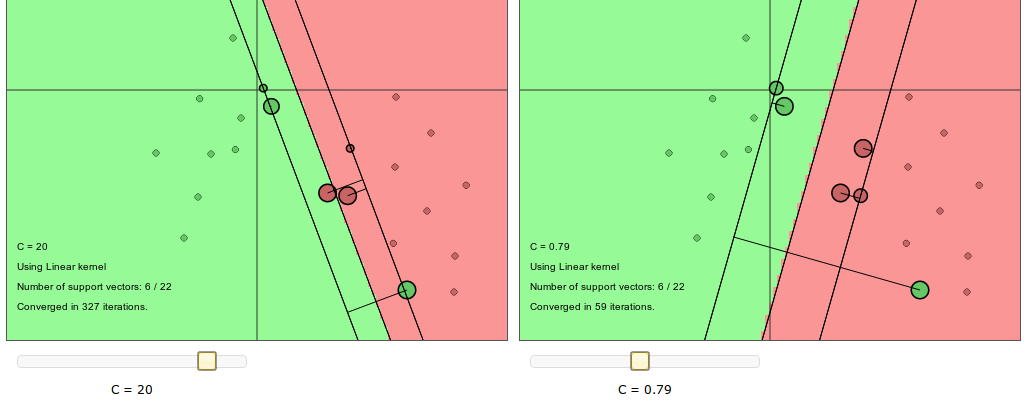
Two important user-selectable variables are C (margin parameter) and σ².

Right: large, Left: low (source: http://cs.stanford.edu/people/karpathy/svmjs/demo/)
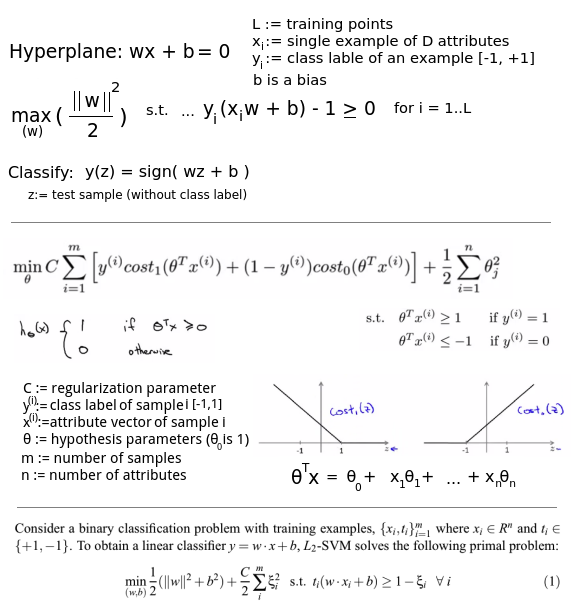
Different ways to define the optimization objective:
Based on class.coursera.org/ml-003, lecture notes and a paper
My main steps now are:
- Find some classified data to work with (or make it up)
- Encode the data in a useful way
- Normalize the data
- Program the linear SVM function with a linear kernel
- Find a library to solve the minimization problem
- Plug the answers back into the SVM formula and get the decision boudary
- Divide the data using cross validation and measure the performance
- Implement another kernel if time permits
Two important user-selectable variables are C (margin parameter) and σ².
- When C is large we get low bias but high variance and in practice we will see outliers being fitted better. When C is low we have high bias but low variance and outliers are given less weight.
- σ² is used with kernels and the main idea is that each sample is used as a reference point and applied a function to transform it into a higher dimensional space. The σ² determines how far from each reference point this function applies. A small σ² will give a weak "gravity" field around each reference point and a high σ² will increase the field strength.
Right: large, Left: low (source: http://cs.stanford.edu/people/karpathy/svmjs/demo/)
Different ways to define the optimization objective:
Based on class.coursera.org/ml-003, lecture notes and a paper