In order to know how good a machine learning algorithm is we need to compare them in a fair way. It's always possible to train a classifier so that is gives 100% correct answers to the training samples, but that does not mean it will be 100% for new samples not seen before. We don't want to learn answers, we want to generalize and find patterns!
Classification
We have methods for binary classification problems and for multiple class classification.
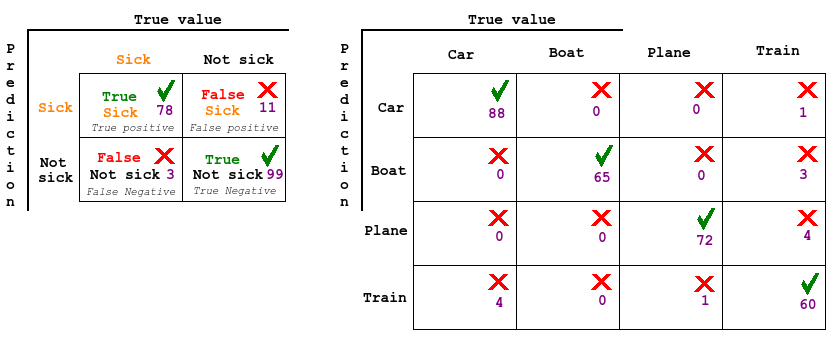
In both cases Confusion matrix are a great tool. In binary decision it's usual to classify as true or false positives or negatives, and with multiple classes we just map up the combinations.

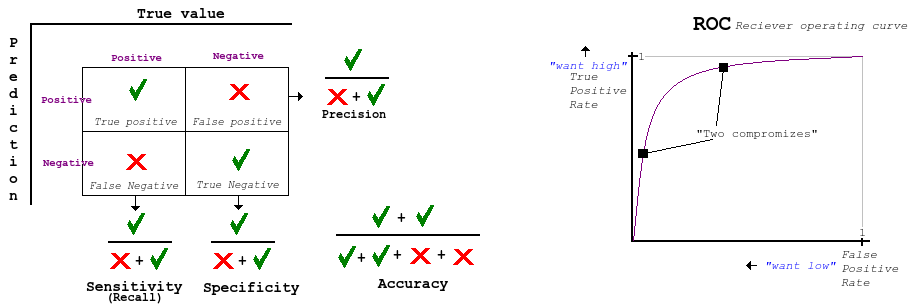
False positive (type I) is bad because the subject might get an intrusive medication that does damage when there was no risk. Or saying a program is a virus when it's not, leading to disturbance and waste of investigation time. False negative (type II) are often considered worse. Like when a patient has cancer but it's not discovered or a maliciousness attack is not discovered. The goal is to balance these two errors via some cost function. Lets say one type of error is much more expensive/risky than the other. Lets say we have a group of 100 people and 50 are sick. We then classify everybody as sick. We then get all the sick people correctly, and have 0 false negatives, but we have a very high false positives. This is where we can use the ROC curve to graph the relation between x: the false positive rate (1 - specificity) and y: the true positive rate (sensitivity)
Brier score (seldom used) is a probabilistic method,
Recall (sensitivity), precision and F-measure was mentioned and are used in information retrieval.
Regression
Means Squared Error or Mean Absolute Error are often used
During the exercise we redefined well-posed learning problem, generic machine learning approach and the types of problems it can solve
We did the linear least squares algorithm on some toy examples and implemented a very simple Decision rules approach algorithm. Basically if attribute #2 is between a and b, classify as A, then if not, if attribute #5 is more than c, classify as B etc.
For the preprocessing step we did some tasks on outlier detection (remove noise), extrapolation (guess sinuous function from missing data), discretization, and plotted some 3D graphs to see how we can estimate global minimum and maximum (extremism)
Classification
We have methods for binary classification problems and for multiple class classification.
In both cases Confusion matrix are a great tool. In binary decision it's usual to classify as true or false positives or negatives, and with multiple classes we just map up the combinations.
False positive (type I) is bad because the subject might get an intrusive medication that does damage when there was no risk. Or saying a program is a virus when it's not, leading to disturbance and waste of investigation time. False negative (type II) are often considered worse. Like when a patient has cancer but it's not discovered or a maliciousness attack is not discovered. The goal is to balance these two errors via some cost function. Lets say one type of error is much more expensive/risky than the other. Lets say we have a group of 100 people and 50 are sick. We then classify everybody as sick. We then get all the sick people correctly, and have 0 false negatives, but we have a very high false positives. This is where we can use the ROC curve to graph the relation between x: the false positive rate (1 - specificity) and y: the true positive rate (sensitivity)
Brier score (seldom used) is a probabilistic method,
Recall (sensitivity), precision and F-measure was mentioned and are used in information retrieval.
Regression
Means Squared Error or Mean Absolute Error are often used
During the exercise we redefined well-posed learning problem, generic machine learning approach and the types of problems it can solve
We did the linear least squares algorithm on some toy examples and implemented a very simple Decision rules approach algorithm. Basically if attribute #2 is between a and b, classify as A, then if not, if attribute #5 is more than c, classify as B etc.
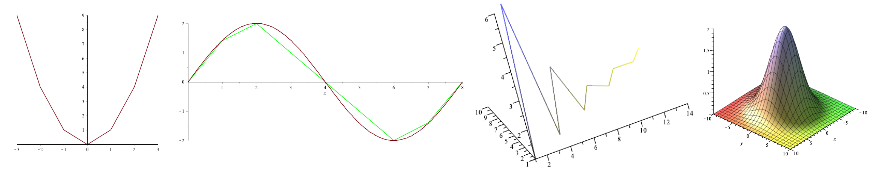
For the preprocessing step we did some tasks on outlier detection (remove noise), extrapolation (guess sinuous function from missing data), discretization, and plotted some 3D graphs to see how we can estimate global minimum and maximum (extremism)