IDS lecture 4
14 sept. 2013Anomaly detection the opposite approach to misuse detection. Instead of describing what is attack, lets instead try to describe "what is normal". Misuse databases keep increasing and they don't handle unseen attacks. Anomaly "white listing" has the major problem that there are insanely many "normal" situations, a lot more than the known bad. Also, what is normal depend on the user. A "simple" user might only browse the web and write word documents, while a computer expert might change and reconfigure all the time.
Profiles of normal user (or network) activities are established using metrics associated with thresholds (permitted ranges). The rules must be flexible to adopt to changes in behavior.
Two main areas were presented:
- Statistical
- Parametric: Using assumptions on underlying distribution of data, like Gaussian. The Denning's model (IDES - 80s) form different methods:
Operational: Event counters like password guess. A limit defined "abnormal" (too many tries)
Mean/standard deviation: The main idea is that the mean value of measures are normal, and that when you move away by typically 3 standard deviations you will have abnormal activity. Often weighted by how recent the observations are.
Multivariate: Correlation based on such measurements used in mean/SD.
Markov process: Create a state machine of all possible event. Very sparse and require lots of memory. Probably unfeasible in modern systems. Each transition in the model is assigned a probability based on experience. A combination of transitions, product of probabilities will determine what is abnormal.
These methods are combined to to make predictions regarding normal or abnormal. "IS score" (vector)NIDES (Next generation IDES) were developed later (90s) try to combine (Chi-squared alike statistics) several "activity levels" into a single "normality" measure and compare it with a threshold. Could be number of audits in a log/time interval, cpu usage, network usage, name of files accessed etc. Problem is that real time protection is not possible since these measurements are not real time. It's also difficult to find relevant things to monitor (have good predictability power). "T square" score (scalar).
A huge problem is that many situations are not Gaussian distributed and we have a lot of false positive and negative.
- Non-parametric: No distribution assumptions, using classification methods like clustering. The main idea is to collect huge amounts of data, a sample set (vector for each observation) and have an algorithm group similar events. We hope that by asking for two clusters we get normal and abnormal behavior. Classification is divided in hierarchical and partitional (non-hierarchical). In any case a measurement for "close" (distance measurement) must be defined.
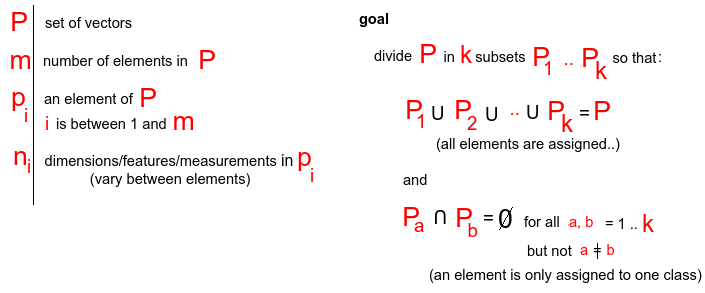
Mathematically we define the goal of clustering like this:

Note that the number of dimensions can be different from sample to sampleIn hierarchical we try all possible combinations of samples, and keep grouping the two most similar. Either similar individual samples or groups of samples. Groups of samples can have a different distance measure than a single sample (like the two most distant (complete linkage) or closest items (single linkage) or simply a group average based on the group members or centroid).
These algorithms have exponential complexity,Another approach is to make some assumption of initial clusters and have the clusters "move" and optimize themselves in the sample data set. This is called partition and is much faster at the cost of being dependent on the initialization. K-means is an example of such an algorithm, see page on clustering in ML.
Different methods for distance measures include minkowski with Euclidean as a special case, edit distance for unequal number of items in compared vectors and Q-gram where one breaks down vectors in smaller parts and compare these parts to determine similarity.
After clustering (in two clusters) one must decide on which cluster is attack, and hence the other as normal. A commonly used assumption is that the cluster with lowest carnality (fewest members) is the abnormal. This method fails on large attacks such as denial of service (DoS) attacks. A measure named after it's creators Davies Bouldin index is calculated to get a measure of how concentrated a cluster is. A new assumption is that a very compact "black hole" cluster represent a DoS type of attack and this information is used for determining such an event.
- Parametric: Using assumptions on underlying distribution of data, like Gaussian. The Denning's model (IDES - 80s) form different methods:
- Systems with learning: The reason why clustering is popular is that it does not require labeled data, meaning samples that has already been assigned "normal" or "abnormal" in this context. Clustering is also a smart way to group unstructured data and then try to label it based on that cluster it is a member of. Systems with learning refers to supervised learning where algorithms try to learn based on correctly classified examples. Neural Networks (and it's clustering cousin Self Organizing Maps) was mentioned as an example. The goal in neural networks is to find the correct weighting of connected neurons so that the input features predict the output of the network when learning and then use these weights on new data to make predictions.
Exercise
<calculate IDES with and without mutually correlation>
<calculate NIDES score with same numbers> (NIDES score assumes no mutually correlation)
<perform 1 round of k-means on a simple problem>
