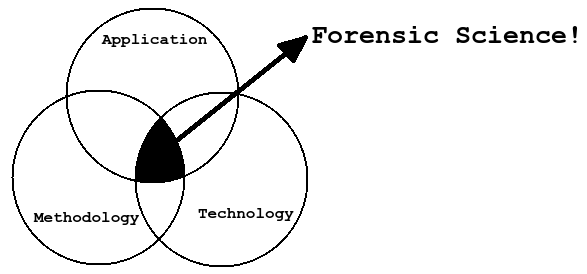
Introduction
15 jan. 2013Machine learning and pattern recognition is basically the same thing with different names from different disciplines. Called "predictive analysis" in the business filed. Collect data, model and predict future.Machine learning is defined via asking "a well posed learning problem": A machine can be said to learn from experience if performance increases with more experience. Defining experience and performance is the hard part. In essence: Can we make the machine look like it's smart?
Machine learning can be broken down in many ways. One is to look at what kind of experience we give it. It is assumed a collection of samples is given in machine readable form. Each sample have different attributes like age, heights, color, blood type, speed.. anything that can be measured. If a sample contains 10 things/attributes, we can also say it has 10 dimensions. If we give only this information to a machine learning algorithm it is said to be unsupervised. It's just data and the algorithm must find patterns. Often so called clustering, but it can also be density estimation and dimensional reduction.
Now, lets say we want to predict some outcome based on the attributes (properties) of a new sample (other than saying it looks like it belongs with an unsupervised learned group (cluster), then we must provide the correct answer on some samples (called the training samples) in order to predict the correct answer for the test sample. This is called supervised learning, because the learning sample data has already been classified. Types of supervised learning is classification meaning discrete output values into one of a fixed number of classes, and regression where the output is a prediction of a continuous value. Both can be said to "inferring unknown from known".
Other ways to categorize is whether the algorighm continue learning ("on-line" / "active learning") or not, and whether decisions must be made sequencialy or not (reinforcement). It can also be semi-supervised. There is also something called "Deep learning" when we try to learn in steps, find similar categories and then do sub categories. Often this is more efficient as two things can be hard to separate because they are to similar compared to everything else, but when we have separated them from the rest we can find the small difference.
Main useage of ML algorighms:
- Handwriting recognition
- Face recognition (or other things like signs, cars, roads...)
- Speech recognition
- Navigation: drive helicopter or car autonomously
- Build ontologies or classify documents (spam detection)
- Recommendations (like Netflix and Spotify)
- Climate modelling
- Find malware and network attacks
Wikipedia has a page on learning algorithms for a brief overview of methods known in this field.
The motivation for this course was the change from post mortem to proactive forensics. Use machines to search for evidence. The problem is huge amounts of data ("Big data" meaning more data than one computer can easily handle), speed of search, deterministic (versus humans that makes mistakes, need to sleep etc). As a contradiction machine algorithms makes mistakes as well. Google books project has a "get it all" focus compared to finding the tiny difference that malicious activity represents.

Identification versus classification (in classification tasks):
- When identifying something we do a 1:N comparison. What is the most likely classification? (is the sample a benign or malicious cancer instance?)
- When verifying somehting we do a 1:1 comparison. Does the pattern belong to the class? (like when you got a set of fingerprints and want to know if a new sample is the same person)
Types of matching:
- Template matching (like k-nearest neighbor)
- Syntactic / structural (???)
- Statistics (like regression)
- Neural networks (more random, heuristic)
Samples attributes are usually represented as vectors and can be visualized as points in a hyperspace (n-dimensional space). The distance between points determine clustering and can be used to build hyper planes in the space that can separate different classes. Attributes should be orthogonal meaning the features are not correlated. If two attributes are highly correlated, some of them might be redundant. The same goes for attributes with now information (entropy) in them. (like they are always the same value for all samples). Different algorithms can be used to determine the distance: Euclidean and hamming are two examples.
Knowledge representation
The idea of knowledge representation is to be able to derive new knowledge from old knowledge. It's often used in data mining. (First order logic and Semantic network were two examples).

By organizing and analyzing data we can get information
By evaluating and interpreting information we get knowledge
By understanding overreaching principles of knowledge we get wisdom
Model for pattern recognition
A model for pattern recognition, redrawn from the paper "Statistical Pattern Recognition: A Review": A two step model for training (learning) and classifying (applying on new things).

- Preprocessing: Prepare the data, standardize, normalize, interpolate, convert between discreet and continuous values.
- Feature selection / extraction: Remove redundant or irrelevant attributes, by filtering (fast) or combining (slow) attributes.
- Learning: Using a particular method, search for optimal rules (knowledge) so that the regression or classification error is minimized. Machines are fast and can try combinations very fast although it does not "understand" the data.
- Feature measure: Use the results from feature selection/extraction phase in order to collect the same subset of attributes.
- Classify: Use the learned rules to classify new samples.
In Machine learning we got an overall model that is somewhat similar, but has some more steps: (It's mostly relevant for supervised learning)
- Collect data: What attributes are necessary for predicting the classification?
- Select and tune model: What ML algorithm to use? compromise between complexity (understandability), performance and speed.
- Search for optimal rules: Try all or relevant combinations of rules to find the best one.
- Benchmark: Measure performance on unknown data. Avoid over and under fitting (too much or little generalization) and compare with other methods. Cross validation is often used when having a limited number of known (classified) samples: Split up the samples and use parts for learning and parts for verification and then rotate.
- Understand decision rules: Be able to explain why a sample is classified as A or B
In the first exercise we worked on different kinds of random variables and their distribution. Normal distribution (Gaussian / Bell curve) vs uniform (square) distributions. (Poisson for discrete values) Importance of knowing the real distribution of data (probability density functions).
Difference between average (arithmetic mean), median and mode. How quartiles are calculated and their usage in box-plots. Sometimes when data is not normally distributed it's better to use the median value and quartiles instead of average and standard deviation because of skewness in the probability distribution. (Using box plot with median, upper and lower quartile, min and max is always "safe").
Independent vs dependent variables as already known from scientific methodology (does variable A depend on what the variable B is?)
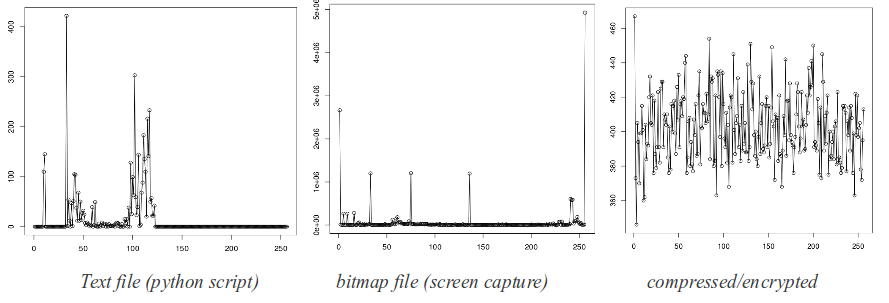
We also did some frequency analysis of different files related to entropy and also did linear approximation.

#!/usr/bin/pythonimport os
import sys
import mathdef mean(samples):
sum = 0.0
for s in samples:
sum += s
return sum / len(samples)def stdDev(samples):
a = mean(samples)
powsum = 0.0
for s in samples:
powsum += math.pow(s - a, 2)
return math.sqrt(powsum / len(samples))def normPDF(mean, stdDev, x):
exp = -(math.pow(x - mean, 2) / (math.pow(2 * stdDev, 2)))
return (1.0 / (stdDev * math.sqrt(2 * math.pi))) * math.pow(math.e, exp)def conv_freq_vector(ft):
vector = []
for item in ft:
count = 0
while count < item[1]:
vector.append(item[0])
count += 1
return vectordef sort_vector(vector):
return sorted(vector)def percentile(vector, percent):
index = (percent / 100.0) * (len(vector) + 1)
return sort_vector(vector)[int(round(index)) - 1] # no interpolationdef read_binary(filename):
freq_count = [0] * 256 # prepare a counter storage
try:
with open(filename, mode='rb') as file:
while True:
byte = file.read(1) # one byte at a time
if byte:
freq_count[int(byte.encode('hex'), 16)] += 1
else:
break#print(freq_count)
runR(freq_count, 'ploto', filename)except(IOError):
print('I can\'t find the file "%s"') % filename# Create and run a .r script to generate density graph
def runR(vector, type, name, min=False, max=False, spacing=False):
rscript = "./%s.r" % name
rscript_head = 'pdf(file="%s.pdf")\n' % name
rscript_data = 'x <- c(%s)\n' % ', '.join([str(item) for item in vector])
if type == 'density':
rscript_method = 'plot(density(x))'
if type == 'histogram':
rscript_method = 'hist(x, seq(%s, %s, by=%s))' % (min, max, spacing)
if type == 'ploto':
rscript_method = 'plot(x, type="o")'
try:
fh = open(rscript, 'w+')
fh.write(rscript_head + rscript_data + rscript_method)
fh.close()
except:
sys.exit("Could not create rscript")sys.stdout.write("Generating graph using R... ")
os.system('R --slave < ' + name + '.r > /dev/null&')
print('"%s.pdf" in the working directory') % nameos.system('clear')
print("*** TASK 2.1 ***")
vector = [1.12, 12.3, 1.1, 0.1, 102.0, 10.1, 8.7]
pdfX = 5
print("Given vector: %s") % vector
print("Mean value is: %s") % mean(vector)
print("Standard deviation is: %s") % stdDev(vector)
print("Probability density for %s: %s") % (pdfX, normPDF(
mean(vector),
stdDev(vector),
pdfX)
)print("\n*** TASK 2.2 ***")
vector = [1, 2, 6, 9, 100, 12, 0.1, 6, 2, 1, 1, 2, 1, 2]
print("Given vector: %s") % vector
print("Sorted vector: %s") % sort_vector(vector)
print("Lower quartile: %s") % percentile(vector, 25)
print("Upper quartile: %s") % percentile(vector, 75)print("\n*** TASK 2.4 ***")
frequency_table = [[2, 5], [3, 3], [4, 9]] # [number, frequency]
vector = conv_freq_vector(frequency_table)
percentileX = 50
print("Given frequency table: %s") % frequency_table
print("Given vector: %s") % vector
print("Mean value is: %s") % mean(vector)
print("%sth percentile: %s") % (percentileX, percentile(vector, 50))print("\n*** TASK 3.1 ***")
cont = True
while(cont):
print('Name a file to compute frequency of ASCII 8-bit characters ("q" to quit)')
filename = raw_input()
if filename == 'q':
cont = False
else:
read_binary(filename)print("\n*** TASK 3.2 ***")
vector = []
samples = 100000
bytes_entropy = 4
range_min = 0
range_max = 5
for i in range(samples):
vector.append((int(os.urandom(bytes_entropy).encode('hex'), 16) /
(math.pow(2, 8 * bytes_entropy) / (range_max - range_min))) + range_min)print("Generating random vector (%s discrete samples between %s and %s with %s bit of entropy") % (samples, range_min, range_max, 8 * bytes_entropy)
# comment out next line if # of samples are increased as the rendering will slow the runtime considerable
#print("%s") % vector
runR(vector, 'histogram', 'task32-hist', range_min - 1, range_max + 1, 0.1)
runR(vector, 'density', 'task32-dens')